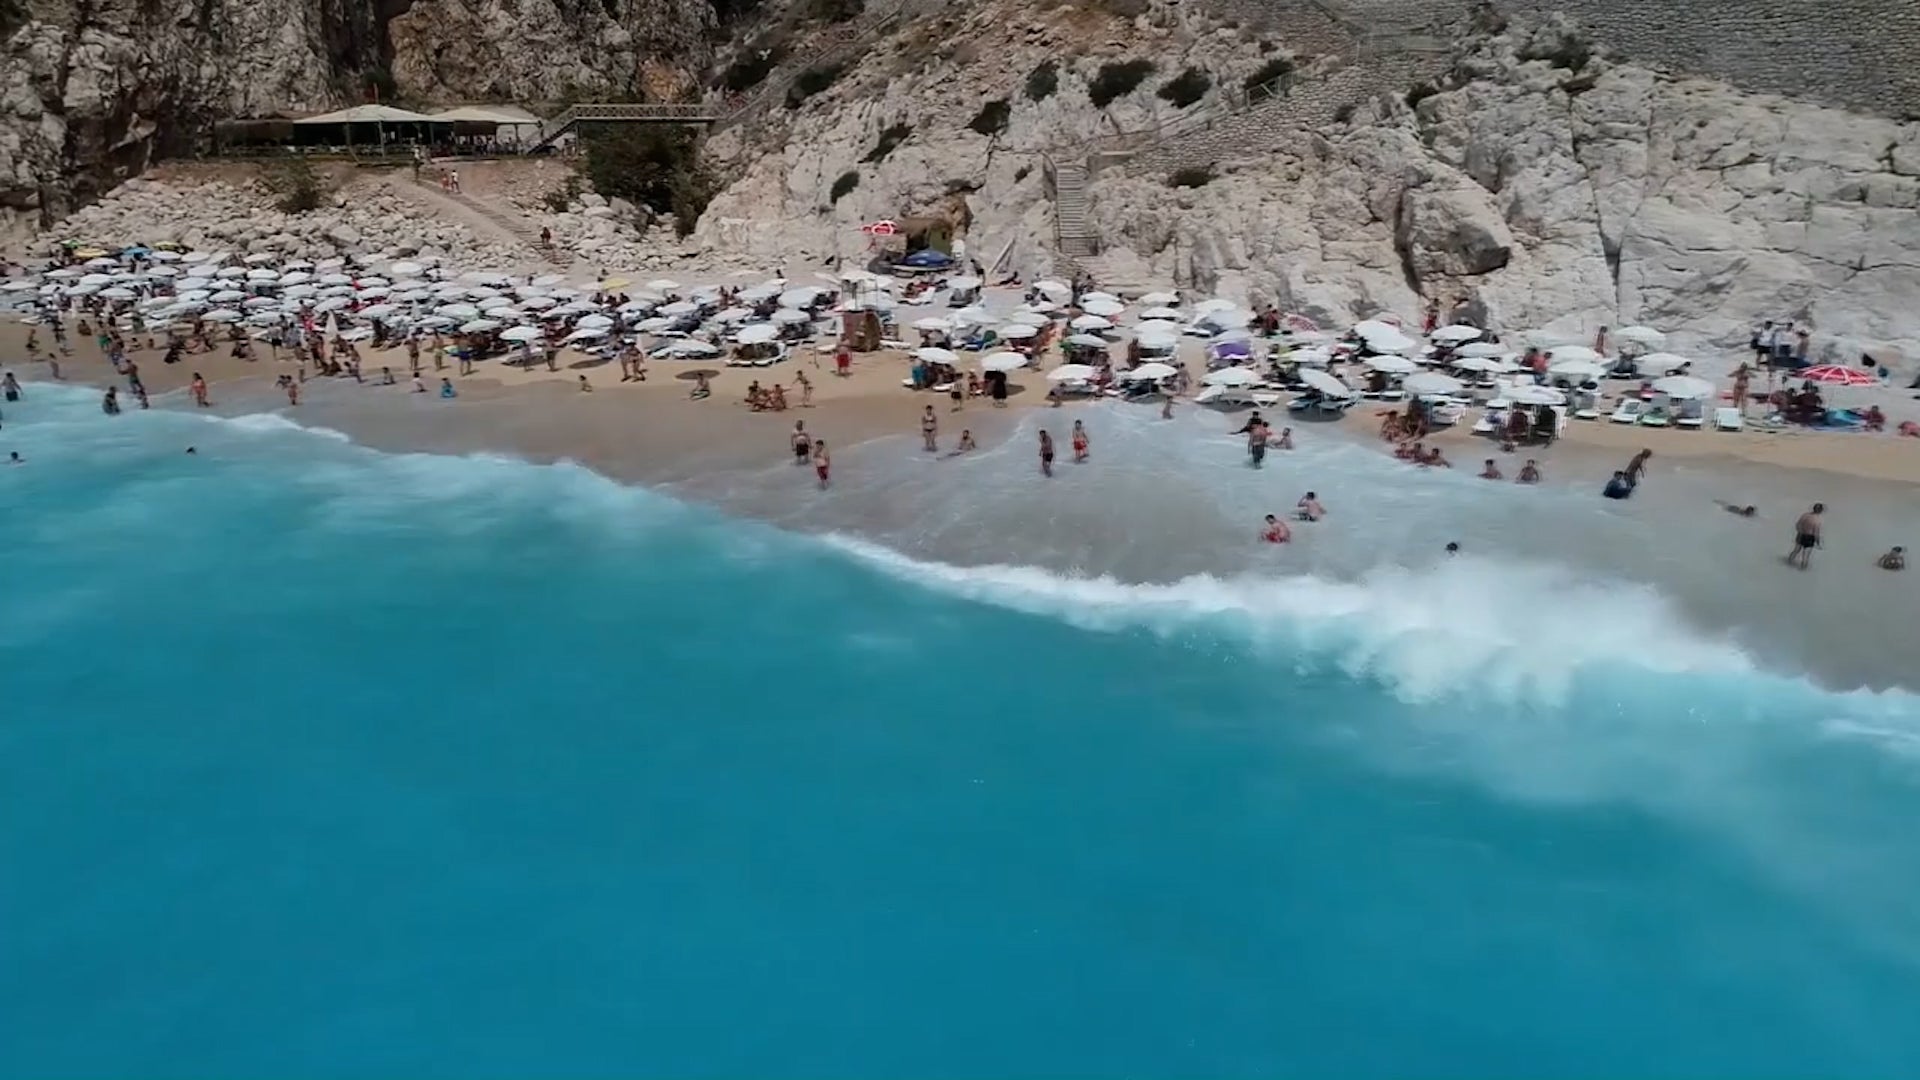
A travel agency collected images from Google Maps and cross-referenced them against the certified bluest shade of blue in order to find the beach with the bluest waters on Earth.
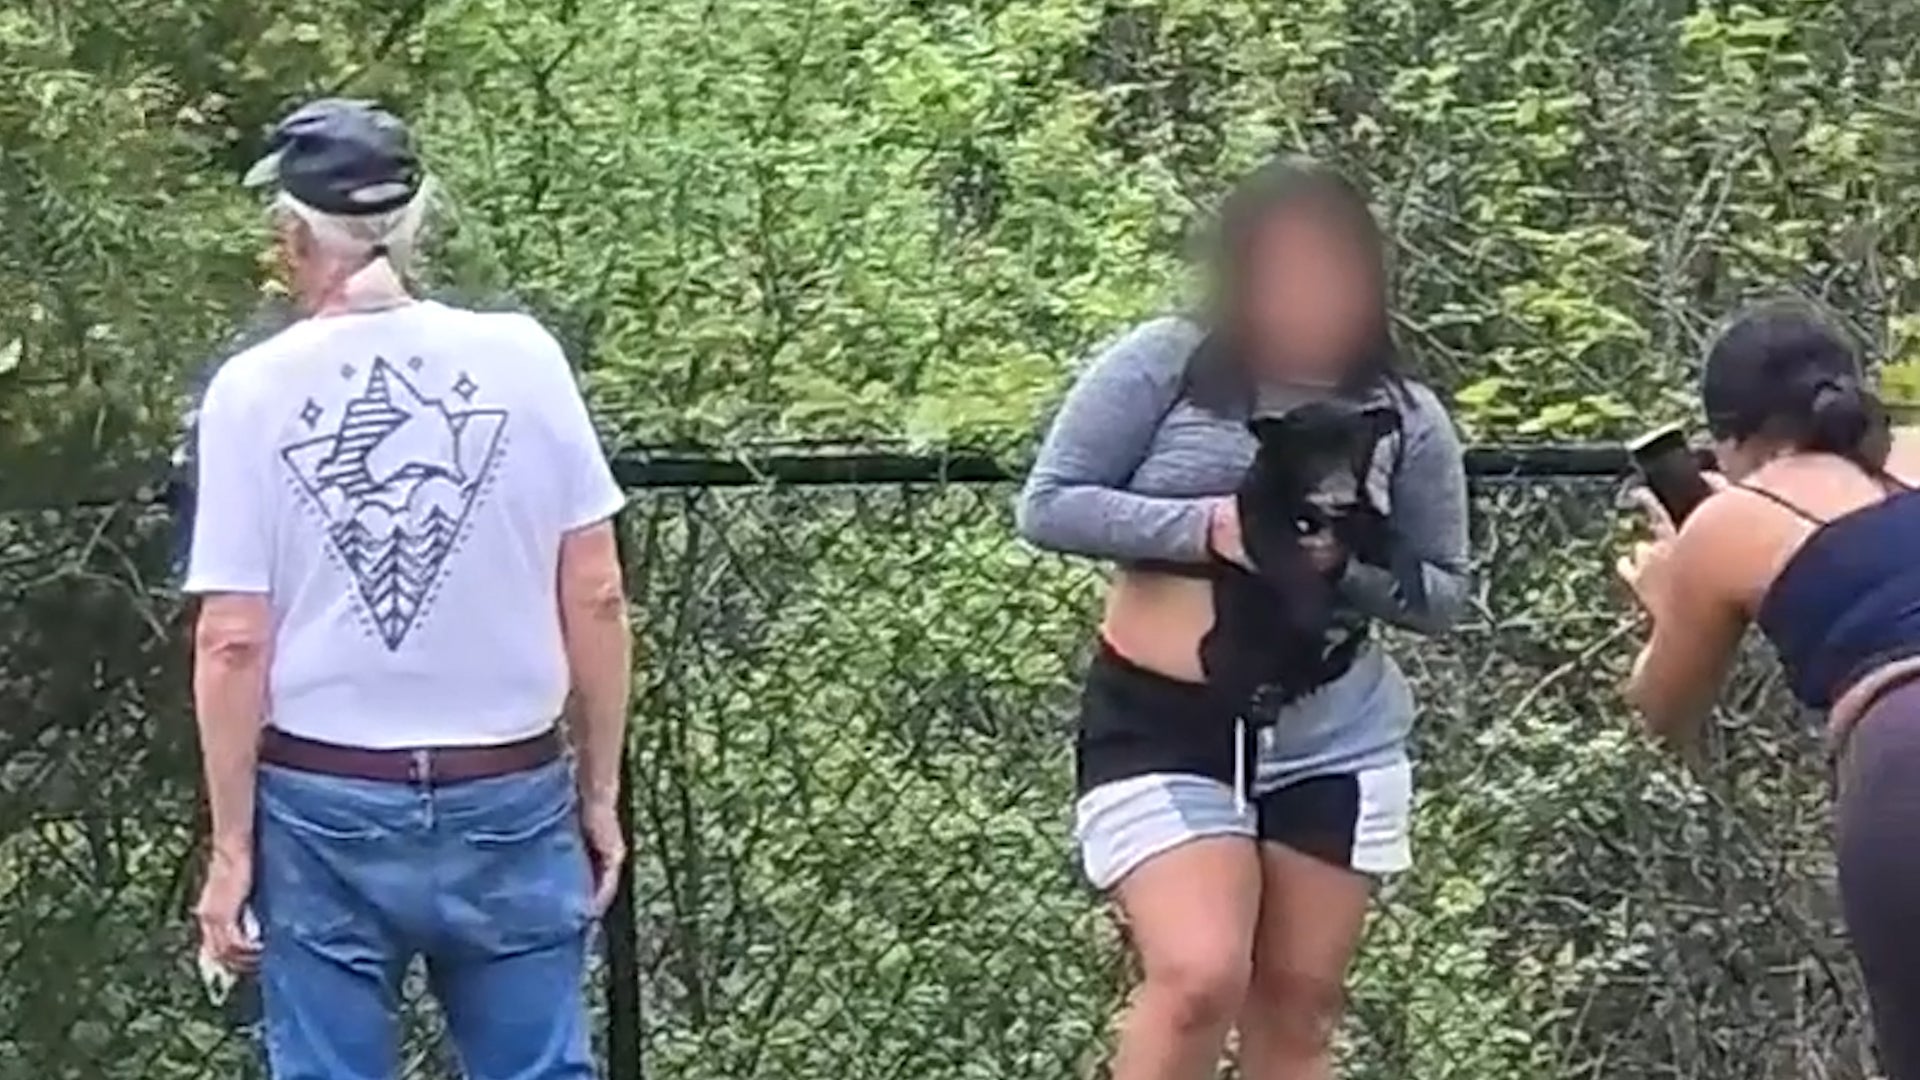
Shocking video shows a group of people pulling black bear cubs out of a tree and then posing for selfies. Watch this video to find out why those people won’t be facing any charges.
Newly released video shows the devastation caused by heavy rain, flooding and landslides in central Ecuador. Dozens of landslides were reported over the weekend; now, emergency officials are trying to get food and other aid to places where the roads are gone and villages are isolated.