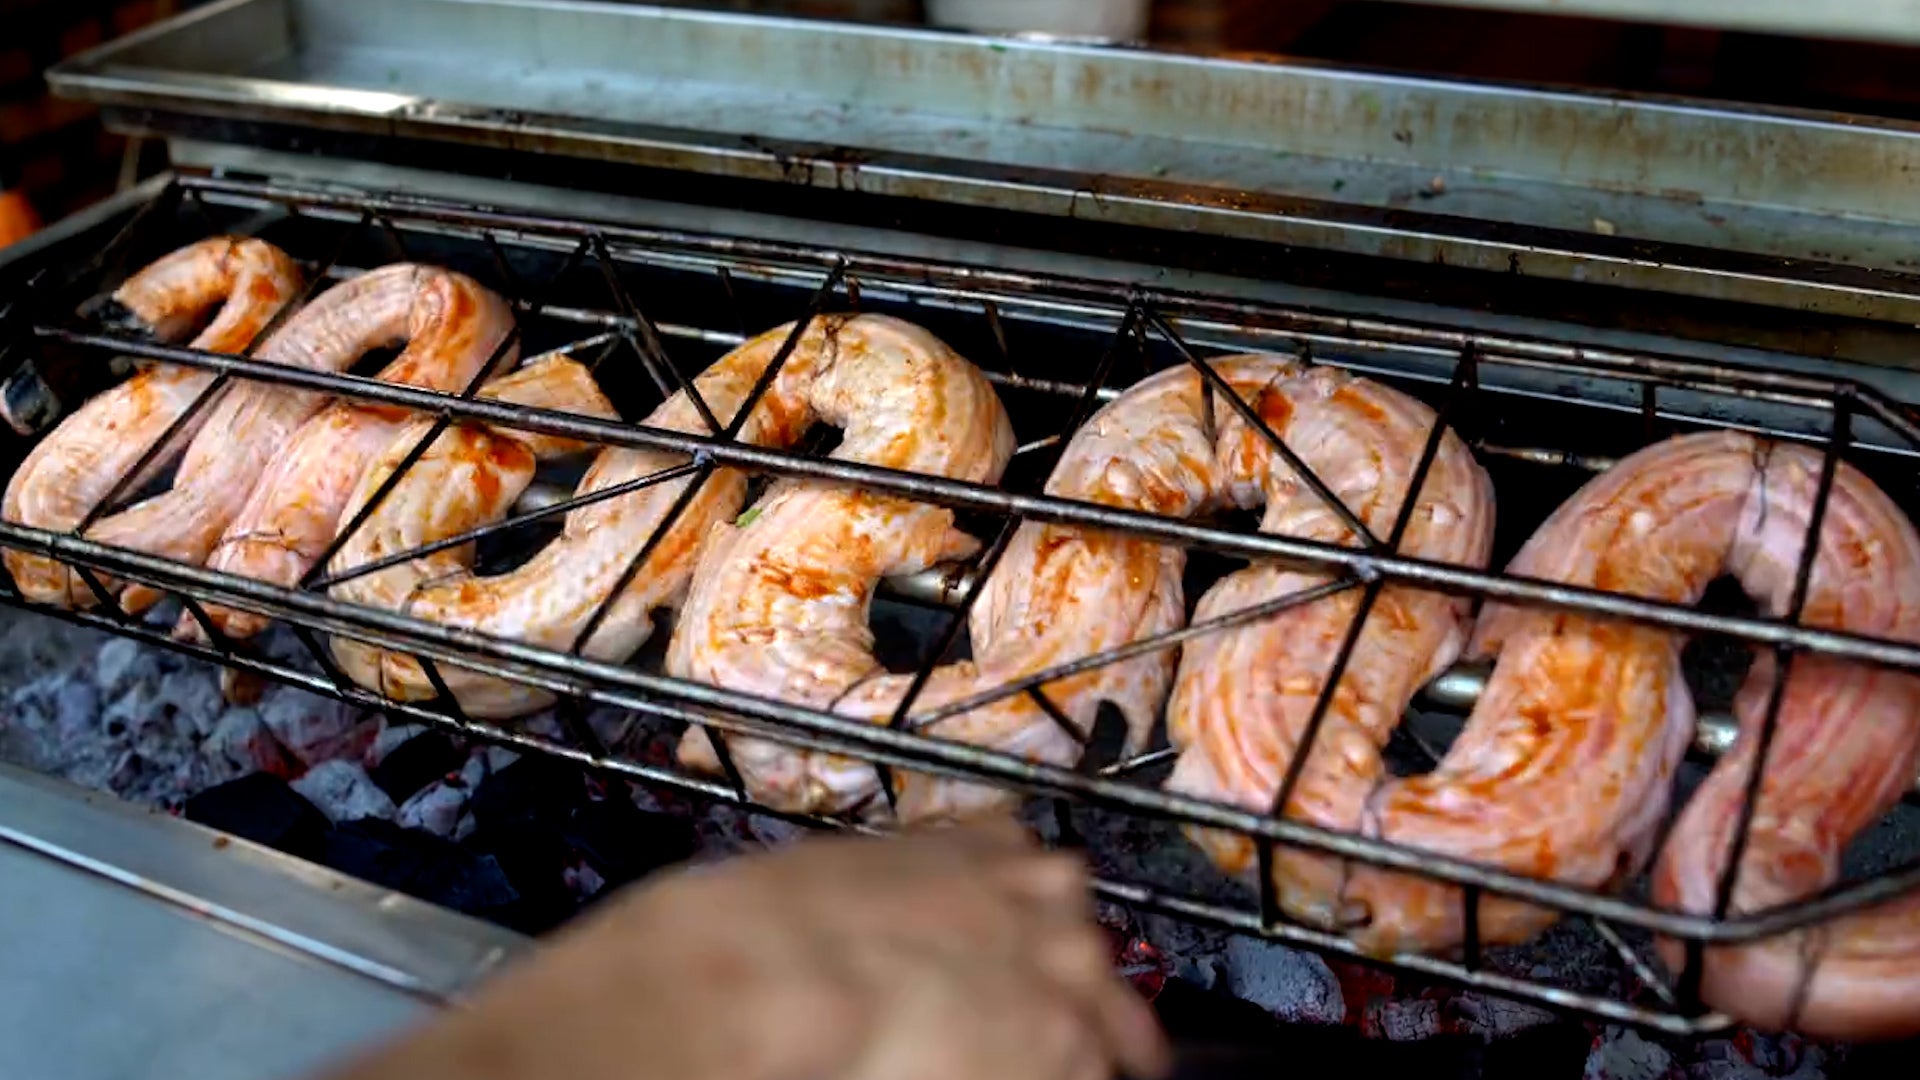
Could this cold-blooded reptile be the next big thing in food trends? It’s cheaper to farm, more sustainable, requires less animal feed to be manufactured and it’s even good for you. While the trend shift could be years in the future, pythons could one day constrict the meat industry.
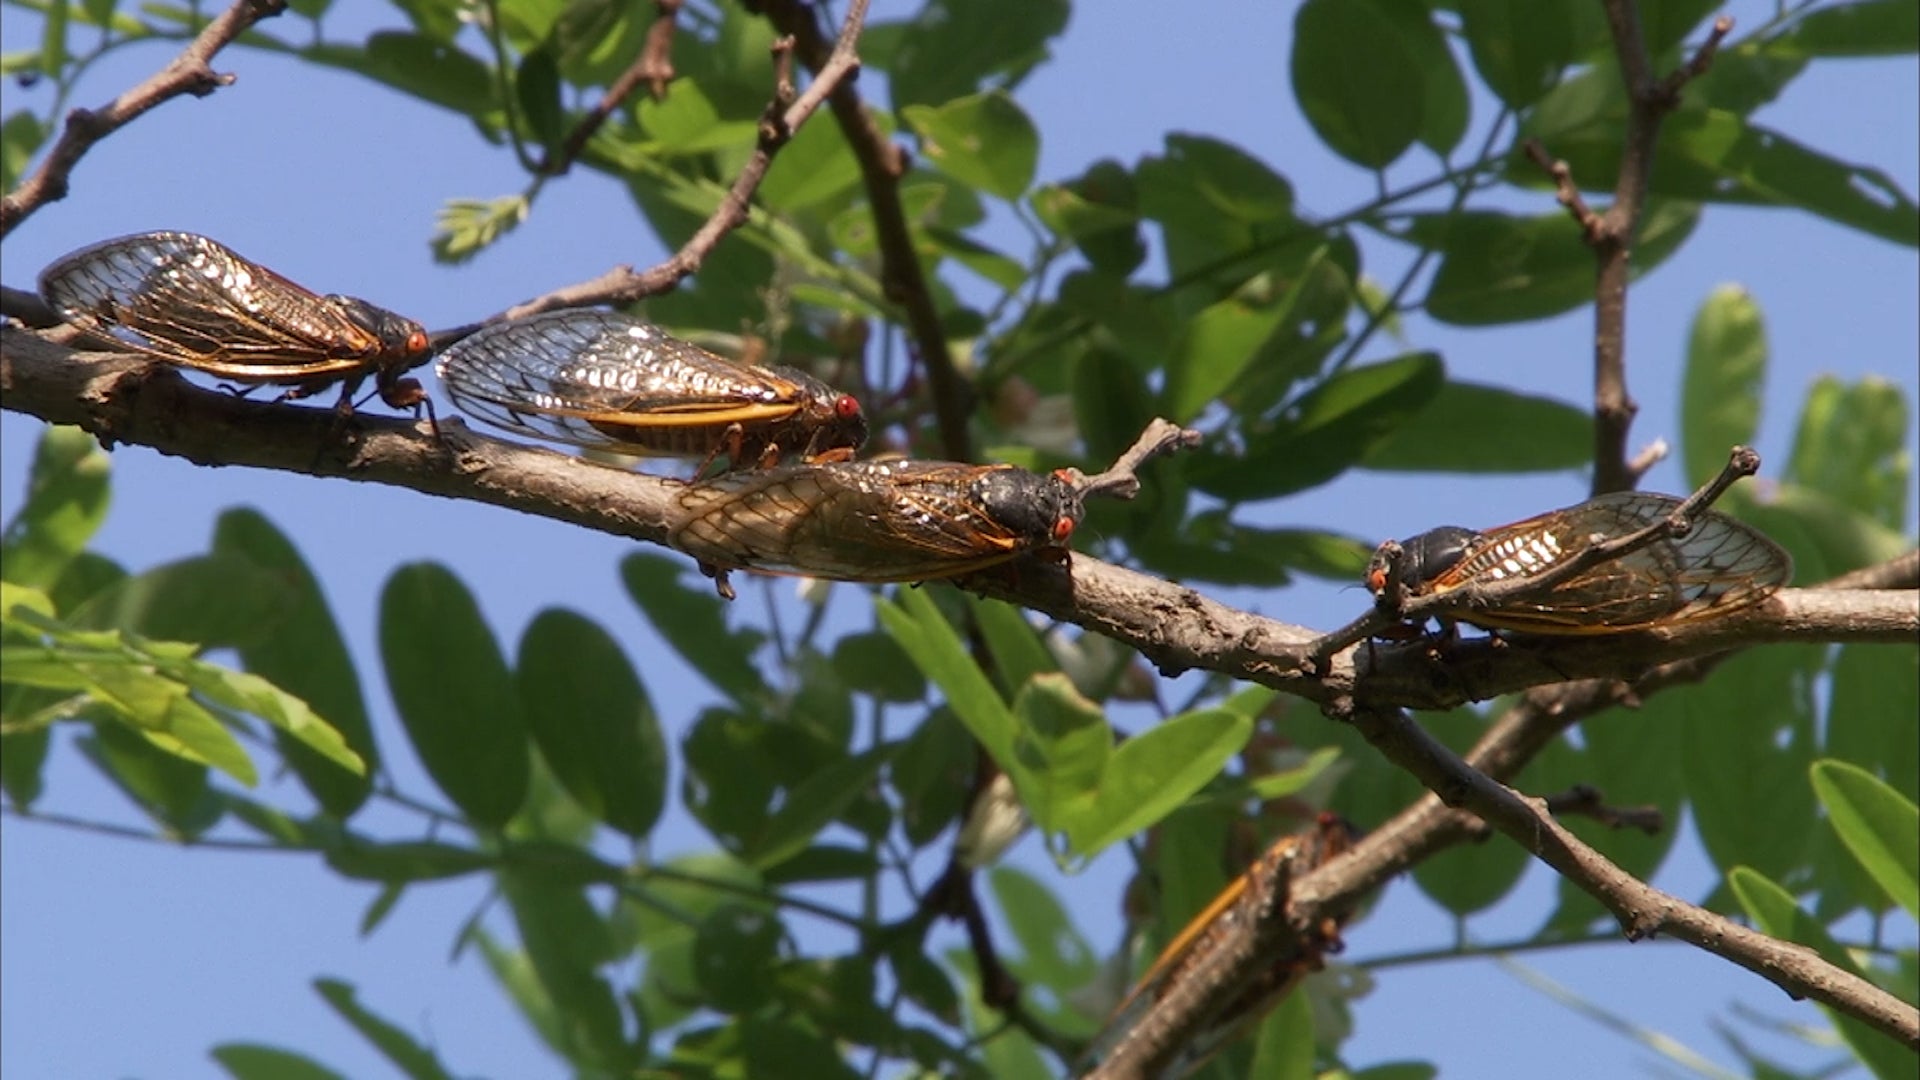
The springtime nature of May means it's a changeable month that typically packs numerous tornadoes, warming temperatures, changing wet and dry seasons and sometimes an early start to hurricane season.