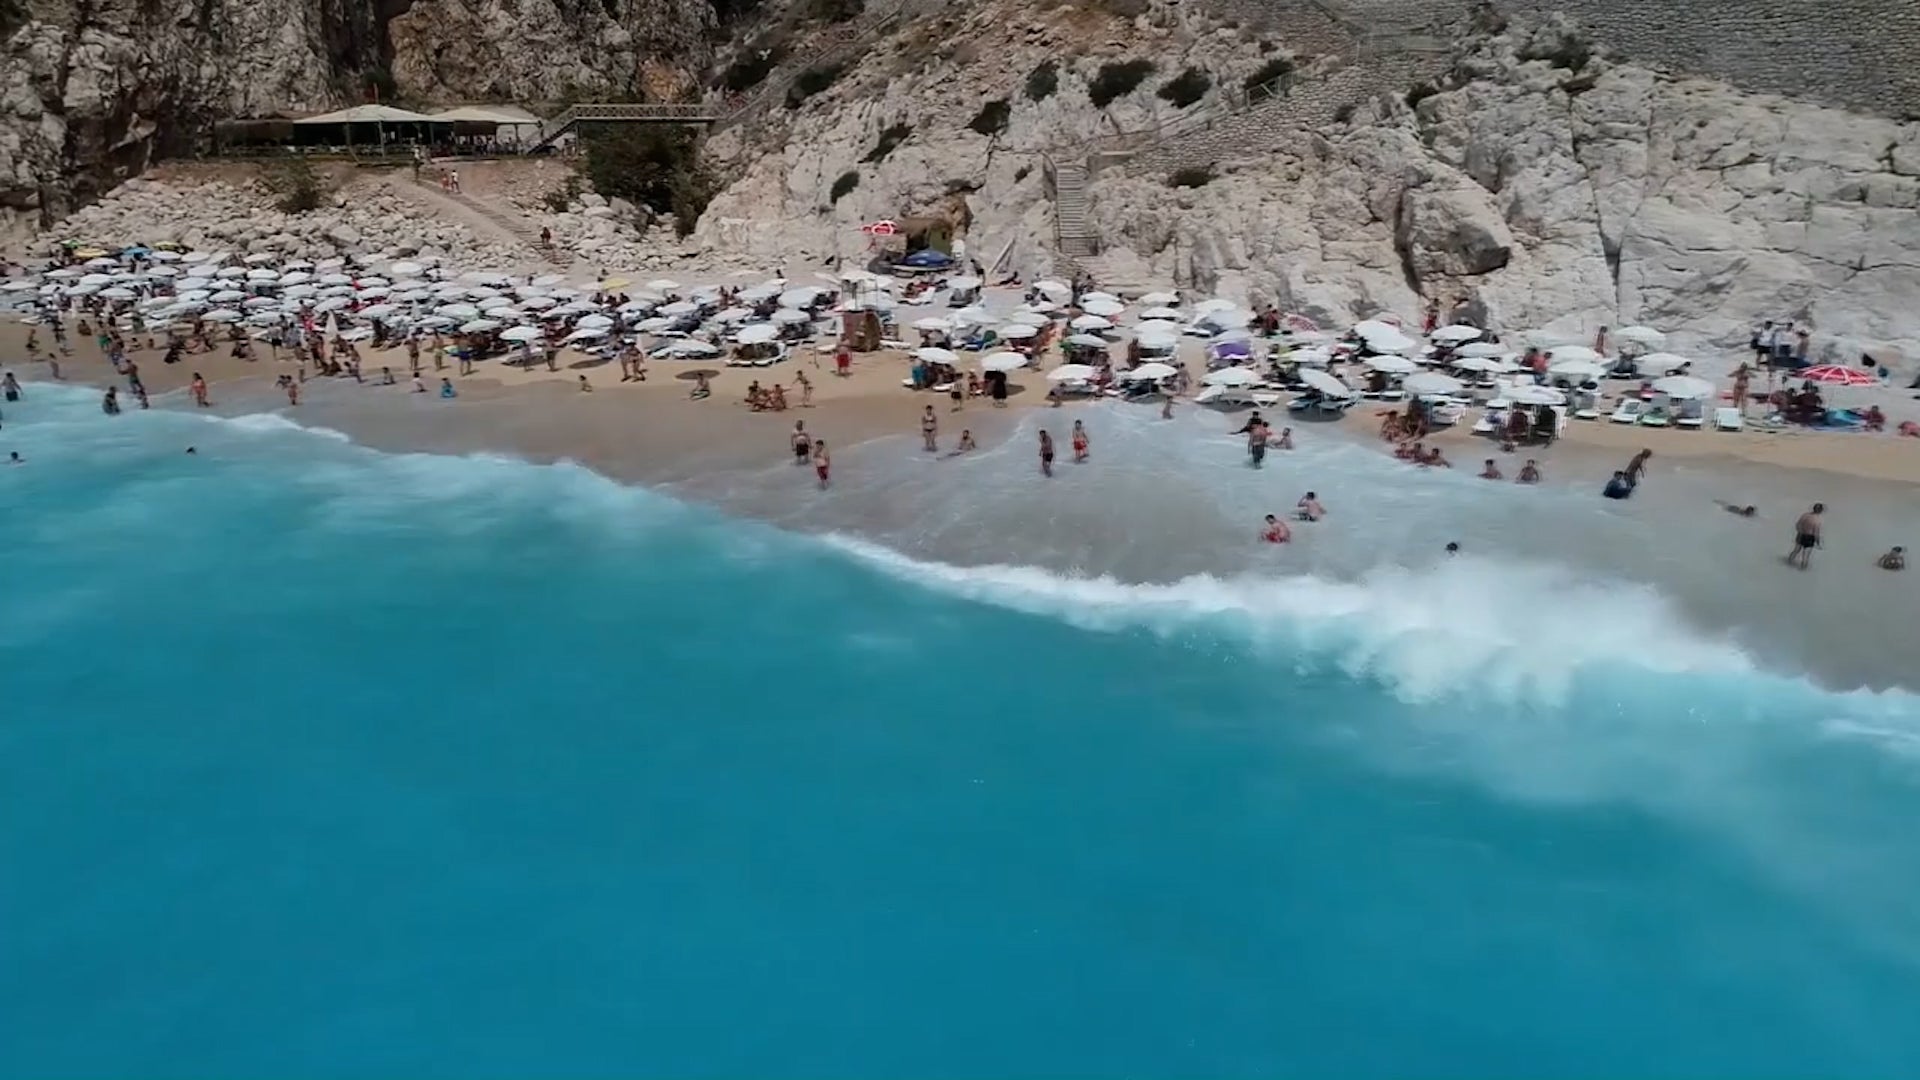
A travel agency collected images from Google Maps and cross-referenced them against the certified bluest shade of blue in order to find the beach with the bluest waters on Earth.
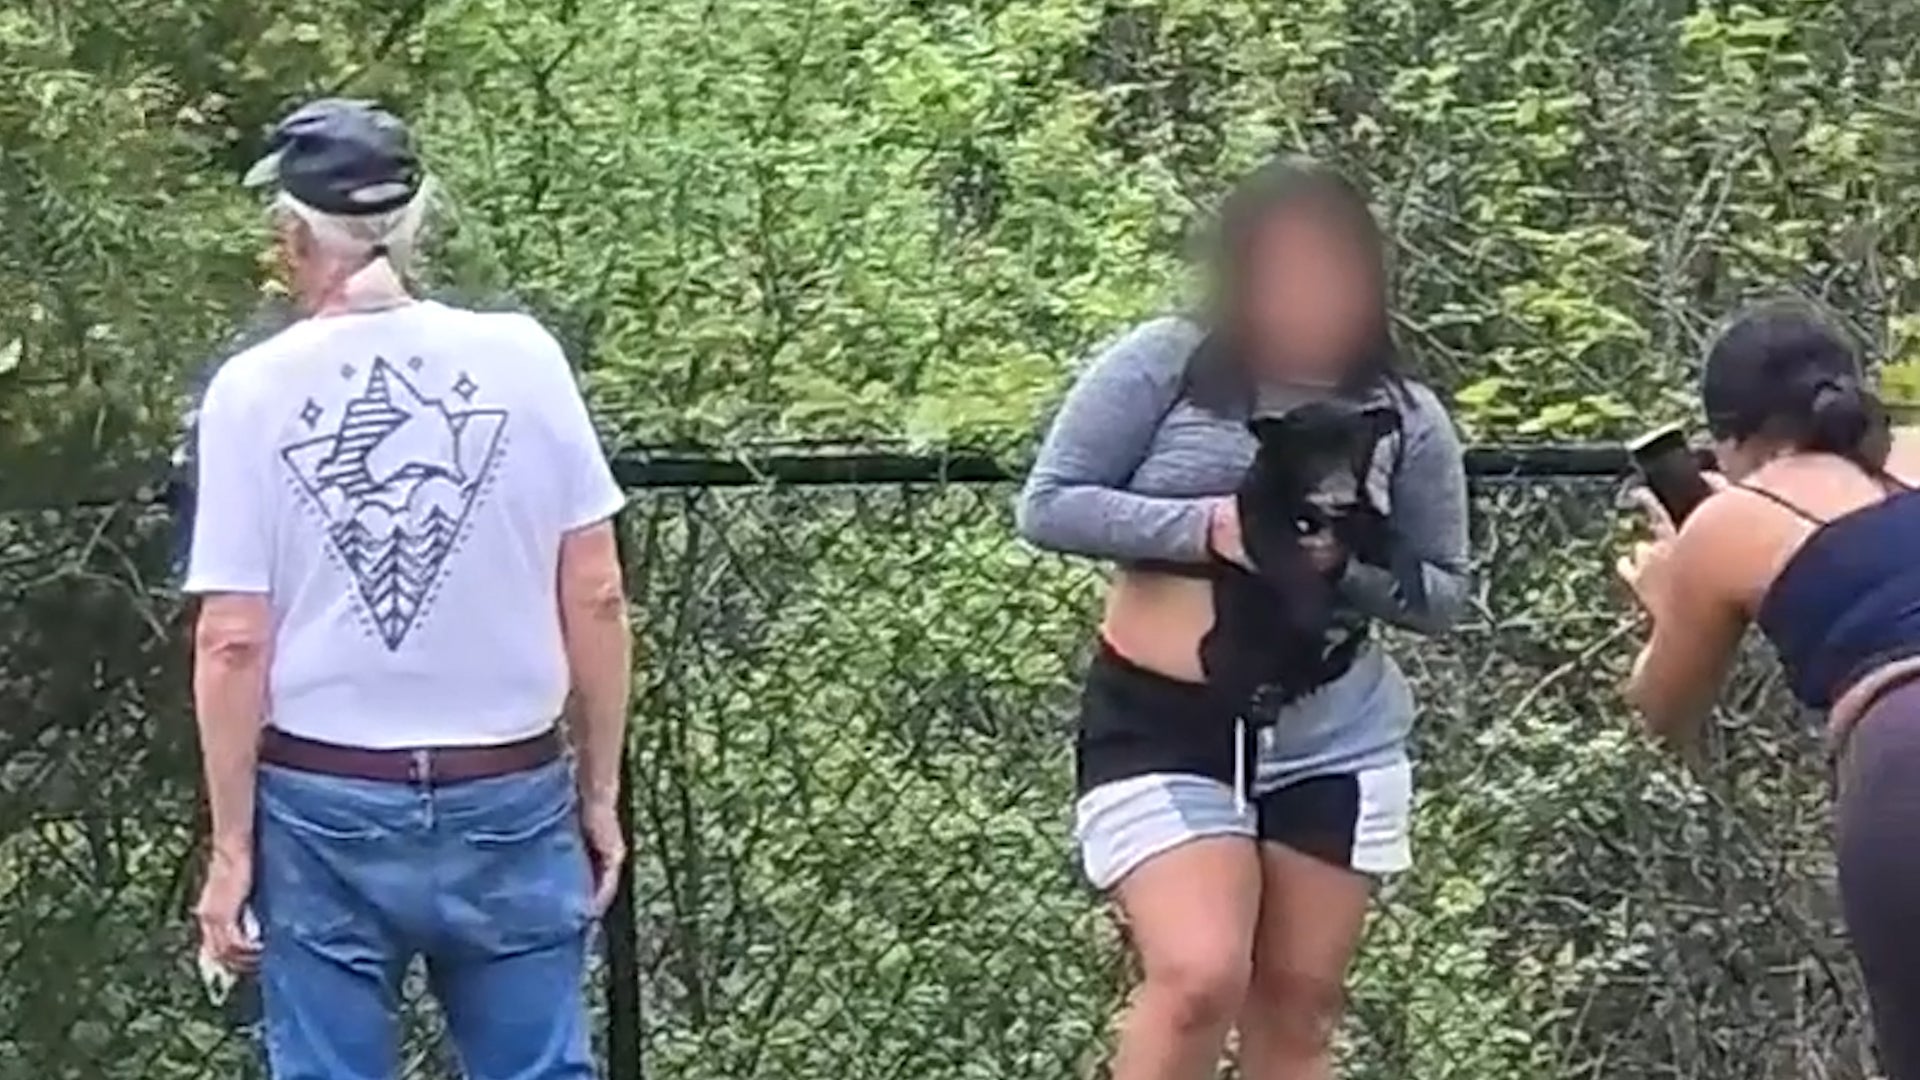
Shocking video shows a group of people pulling black bear cubs out of a tree and then posing for selfies. Watch this video to find out why those people won’t be facing any charges.