Skip to Main Content
_
Sensor Network
Maps & Radar
Severe Weather
News & Blogs
Mobile Apps
More
Search
close
gps_fixed
gps_fixed
Find Nearest Station
Manage Favorite Cities
Log In
Go Ad Free
account_box
Log in
Go Ad Free
settings
Settings
Sensor Network
Maps & Radar
Severe Weather
News & Blogs
Mobile Apps
Historical Weather
star
Current Weather for
Popular
Cities
San Francisco, CA
warning
64
°
F
Sunny
Manhattan, NY
71
°
F
Fair
Schiller Park, IL (60176)
72
°
F
Sunny
Boston, MA
69
°
F
Fair
Houston, TX
warning
83
°
F
Partly Cloudy
St James's, England, United Kingdom
52
°
F
Partly Cloudy
Search
close
gps_fixed
gps_fixed
Find Nearest Station
Manage Favorite Cities
settings
warning
Active Advisory
:
Small Craft Advisory
(
See More
)
--
Feels like
--
--
--
/
--
--
--
--
--
--
--
--
--
--
12AM
6AM
NOON
6PM
12AM
May 8
+0000
May 9
Full Forecast
Dangerous Weather Pushes Ahead; See When, Where The Risk Is
Another widespread bout of severe thunderstorms is spreading through the Midwest, South and East this week. Here's a look at the forecast.
Dangerous Weather Pushes Ahead; See When, Where The Risk Is
Tornado Slams Michigan; FedEx Facility Damaged, People Reported Trapped
A tornado hit southern Michigan on Tuesday night, striking a FedEx facility in Portage.
Tornado Slams Michigan; FedEx Facility Damaged, People Reported Trapped
Oklahoma Tornadoes Leave 1 Dead Amid Widespread Damage
Multiple towns are heavily damaged in the Plains after a powerful round of severe storms struck the region. Here's the latest.
Oklahoma Tornadoes Leave 1 Dead Amid Widespread Damage
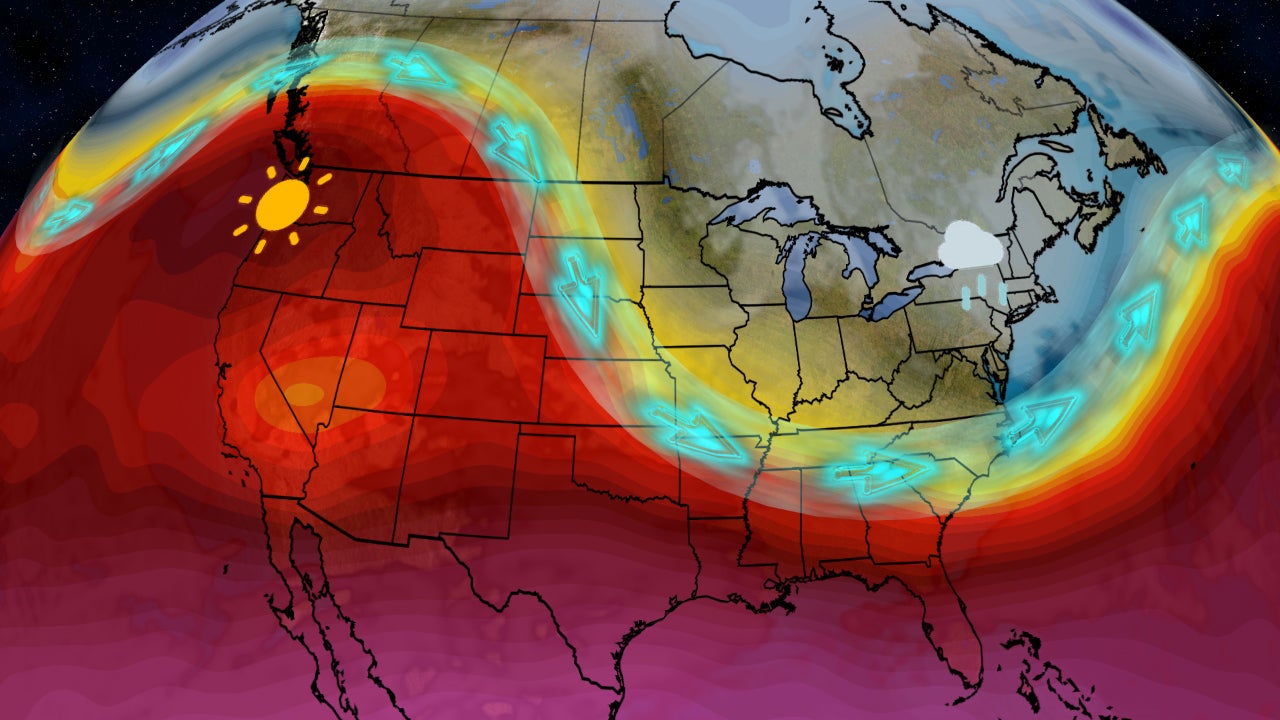
Pattern Change Ahead; What That Means For Your Forecast
Feel like your weather has been stuck in a rut? Here are the changes ahead.
Pattern Change Ahead; What That Means For Your Forecast
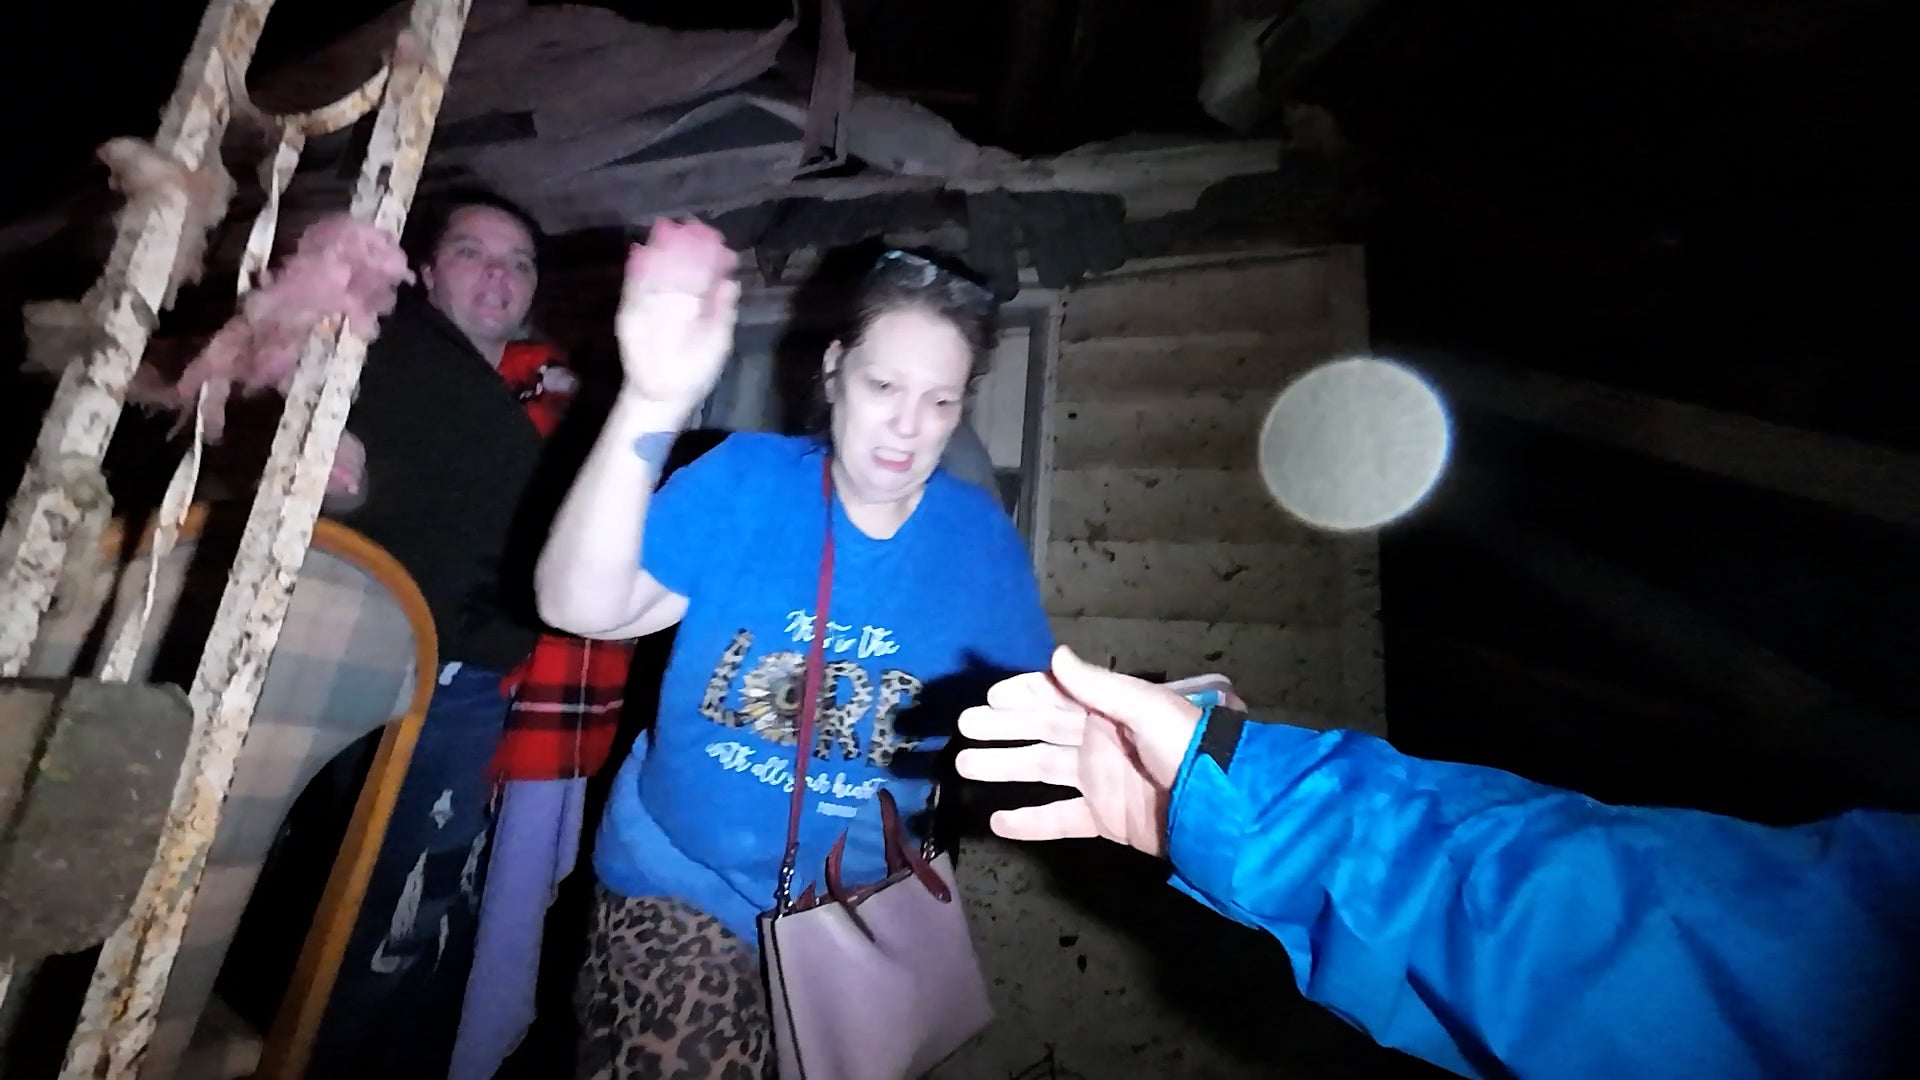
Couple Describes Terrifying Moments During Deadly Tornado
For the second time in about a month, a small Oklahoma town has been smacked by a tornado. In this video, a couple describes the moment they could feel the deadly tornado slamming into their home.
Couple Describes Terrifying Moments During Deadly Tornado
Please enable JavaScript to continue using this application.